Scientists Are Developing Irrigation Maps Of India
Published by Water Network Research, Official research team of The Water Network in Technology
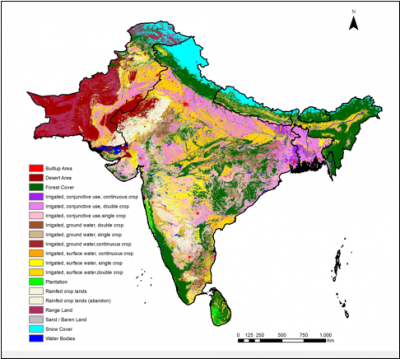
For the first time, high-resolution maps of irrigated areas of India from 2000-2015 have been prepared using remote sensing data.
The maps were validated with ground-based survey data. High-resolution irrigated water maps are essential for estimation of irrigation water demand and consumption on a spatial scale, crop productivity assessments and hydrologic modelling.
The maps were developed by a team led by Dr. Vimal Mishra from the Civil Engineering Department, Indian Institute of Technology, Gandhinagar, Gujarat. The results were published in Scientific Data , a journal from the Nature g roup.
While the irrigation maps developed by the Food and Agriculture Organisation (FAO) are of low resolution, the high-resolution maps of International Water Management Institute (IWMI) are available for just one year and do not cover the entire country.
“So we developed annual irrigated area maps at a resolution of 250 metres for the period 2000-2015 covering all the agroecological zones of India,” says Dr. Mishra. “We used the remote sensed vegetation index data from MODIS [Moderate Resolution Imaging Spectroradiometer] and high resolution (56 metre) land use/land cover data from the National Remote Sensing Center (NRSC) to prepare the maps.
Irrigated areas
In the case of some States the maps tend to overestimate the irrigated areas while in others it underestimates. “Generally, humid areas lead to overestimation of the irrigated areas because of less variation in peak vegetation index, which is used as a threshold to identify irrigated and non-irrigated areas. Also, the resolution of remotely sensed vegetation index data may not be able to fully capture irrigated areas of small land holdings in India. And, a 250 metre pixel is considered fully irrigated even if there is partial irrigation in a small field within a pixel,” he says.
However, the maps have better accuracy in the case of arid and semi-arid regions as vegetation is restricted to areas that are irrigated and therefore the vegetation index truly reflects the vegetation health. “For most States we found our estimates of irrigated area are better in accuracy than the maps developed by IWMI,” he says.
“Since a majority of agroecological zones of India fall in water-limited conditions, we assume that our method is effective for India,” they write. The developed dataset showed better accuracy against the ground-based survey than previously available datasets.
The estimation of irrigated area can be further improved if vegetation index data is available at higher spatial (to resolve small land holdings) and temporal resolution (to accurately capture crop growth cycle, which is essential to differentiate crops that are irrigated and not irrigated).
“We have plans to update the repository every year. By February 2017 we will upload the irrigated area data [in the form of maps] for 2016,” Dr. Mishra assures. The irrigation maps from 2000 to 2015 for the entire country are available in a Geotiff format in a repository and can be be freely accessed by researchers and others.
Putting the maps to test
To highlight the trend and response of irrigation to rainfall variations, the authors chose the Indo-Gangetic Plain, which had witnessed severe drought in 2002 and 2015. To understand how unusual the 2015 drought was, the authors looked at the magnitude of deficit in 2015 monsoon rainfall and also looked at the long-time data from IMD.
“When we analysed the data, two regions —Indo-Gangetic Plain and Marathwada regions — were very distinct. These two regions faced very severe monsoon rainfall deficit in 2015,” he says. “We hypothesised that single monsoon deficit alone cannot result in a severe water shortage in these regions that was witnessed in the post-monsoon season of 2015 and summer of 2016.”
The GRACE satellite data showed an alarming depletion of groundwater in the post monsoon season of 2015. The combined depletion of surface and groundwater resources was caused by the two consecutive droughts over the Indo-Gangetic Plain region.
“The deficit for two consecutive years 2014 and 2015 was 51 per cent. The drought in the Indo-Gangetic plain based on two consecutive monsoon rainfall deficits was ranked one during the period of 1906-2015. Statistical analysis showed that the two-year drought was unprecedented and had a return period of more than 500 years. It means low probability of two consecutive years being drought years,” Dr. Mishra explains.
Source: The Hindu
Tags
Category: Technology
- Agriculture
- Irrigation
- Groundwater
- Data Management
- Solutions
- Groundwater Mapping
- Irrigation Management
- Water Software
- India
2 Comments
The picture shows Central Pivot Irrigators. However there is pivot system in India. I have a patented technology as Solar Powered Constant/Continuous Move Pivot Irrigator. I am struggling for last 10 years to find the user for the same, including all the Government Agencies.
The view shown in the caption is my dream for last 10 years.
Published by Dr. Padmakar Kelkar, CEO at Bright Stars Electronics
Why one is ignoring the fact that in the scenario of scanty recharge, if power is made available to farmers during summers, sure, they will draw water for irrigation and ground water shall be depleted .However, tell me, whether the Total surface run off that goes into the seas has reduced or increased over the past. Uneven distribution of rains means additional surface run offs in other geographies !
Why can't we invest into recycling of surface waters and increase the surface storage besides additional ways to recharge the confined aquifers !
Published by LOKESH PUNJ, A B.TECH. Agr Engg, PGDM-SPA IIMA (1977-9) 25 yrs in Water Piping / Irrigation/Infra Projects